Build powerful forecasts
in seconds.
Turn raw data into forecasts, scenarios, and shareable models — fast enough for ad hoc analysis, powerful enough for real work.
Paste data · Compare methods · Export forecasts
From spreadsheet to forecast in under 30 seconds
Paste a column of history, pick a method, read the range. No setup, no scripting.
Forecasting workflows are too slow and fragmented
Analysts know the rigorous version: update the historicals, test the methods, compare fit, build scenarios, and explain the range. But when leadership needs an answer by tomorrow, the practical version is usually faster: eyeball the trend, hardcode the assumption, and move on.
Too many drivers to update
Every planning cycle means refreshing dozens of revenue, demand, cost, conversion, and retention assumptions.
Too little time to test methods
The right forecast may require comparing trend, smoothing, growth, seasonality, or S-curves — but the deadline usually wins.
The data story gets skipped
Before you make a forecast, you need to understand how it behaves. But when you're moving fast, the data becomes just another column to update.
Forecast any time-series — and backtest it in seconds
Paste a column, load a CSV, or pull a saved data asset. Forecastion fits proven statistical methods and shows you which one actually holds up against held-out data.
- Compare forecasting methods — Holt-Winters, linear & log trend, growth rate, moving average, S-curve and more, compared side by side.
- Automatic backtesting — MAPE, MAE, R² and bias on unseen periods so you trust the number before you ship it.
- Seamless Seasonalization — Understand seasonality and build it into any forecast with seasonal decomposition.
- Tune your training data in real time — with lookback-window and horizon sliders — re-forecast instantly, no formula edits.
 Forecast Lab · Air Passengers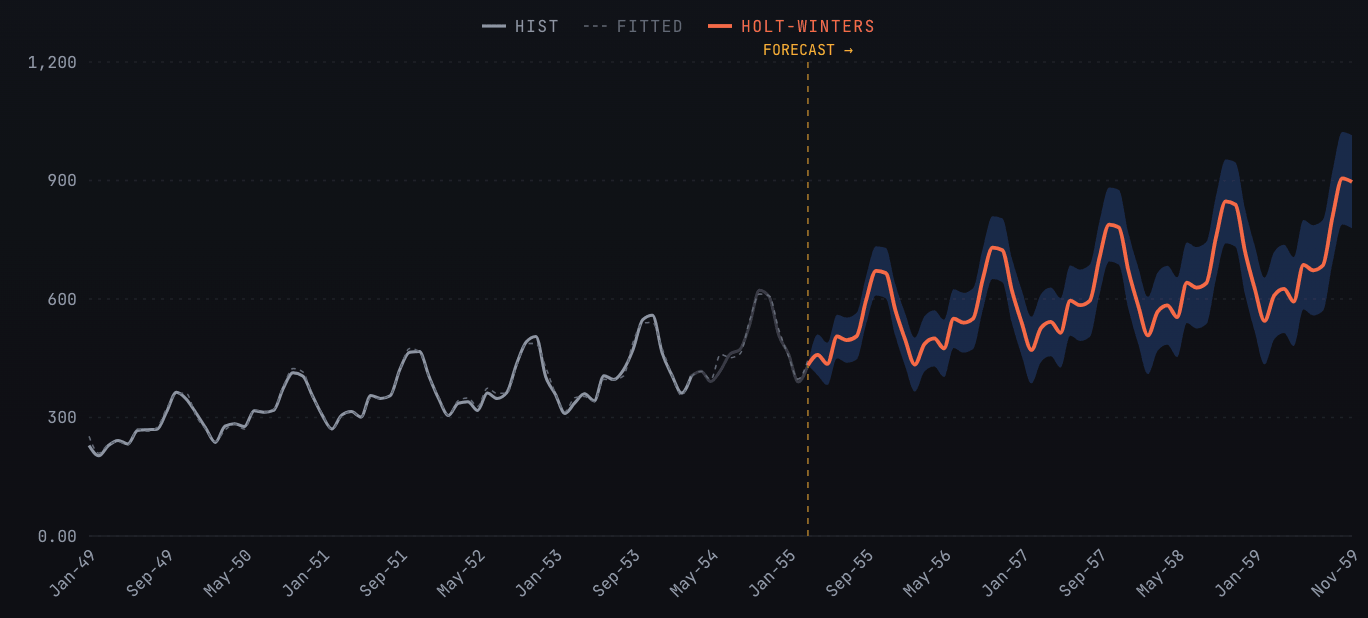
Simulate the full range of possible futures
Stack variables, assumptions and formulas into a live notebook, then run thousands of simulations. Get probability distributions and percentiles instead of a single fragile guess.
- Up to 10,000 simulations — per run, across the horizon you choose — results in real time.
- Distribution-driven assumptions — Normal, lognormal and more, with resampling per period and forecast bounds.
- Combine forecasts with formulas — fold multiple forecasts and assumptions into one probabilistic output, so every downstream number reflects the uncertainty in the drivers behind it.
- P10 / P50 / P90 percentiles — mean, std and CV on every output — the answer leadership actually needs.
Monte Carlo Lab · 5,000 sims · h=36Every model, organized and shareable
Save any Forecast Lab or Monte Carlo model into a Workspace. Group projects by client, business unit or scenario — and bring your whole team into the same source of truth.
From raw data to a defensible forecast
Three steps. No setup, no scripting. Just forecasts.
Load your data
Paste a series, upload a CSV, or reuse a saved data asset. Forecastion profiles it instantly — N, min, mean, max, σ.
Forecast or simulate
Run the Forecast Lab to forecast and backtest against unseen data, or build a Monte Carlo model to capture uncertainty across thousands of paths.
Save & share
Organize everything into Workspaces, share a link with your team, and export results to drop straight into your deck.
The questions every forecast has to answer
“How do we know this forecast is any good?”
Backtest methods against historical actuals and compare accuracy before choosing the forecast.
“What happens if the assumptions are wrong?”
Run bull/base/bear views or full Monte Carlo simulations to show the range of possible outcomes.
“Can we update this before tomorrow's meeting?”
Load in a CSV or paste new data, refresh the forecast, and export results without rebuilding your model.
Make rigorous forecasting
fast enough to use.
Import your data, compare methods, explore the drivers, and build scenarios your team can actually use — without rebuilding the model by hand.
20 minutes · Your data questions answered live