Client forecasts you can
actually defend.
Every number you hand a client gets questioned by someone who didn't build it. Forecastion gives you the evidence behind the forecast — and a link you can share instead of a spreadsheet.
One workspace per client · Backtested accuracy · Shareable snapshots
From spreadsheet to forecast in under 30 seconds
Paste a column of history, pick a method, read the range. No setup, no scripting.
The forecast is the easy part. Defending it isn't.
You're forecasting for people who didn't build the model and will ask where the number came from. Excel gives you the number — it doesn't give you the evidence.
"Where did this number come from?"
A cell reference isn't an answer. You need to show why this method was chosen and how it performed on data it hadn't seen.
A new workbook per client
Every engagement spawns another file, another tab structure, another set of formulas to maintain and re-explain.
Updates mean rebuilding
New month of actuals, and the model needs to be rewired before you can show anything in the next call.
Backtested accuracy is your credibility
Fit multiple methods to the client's history, hold out the recent periods, and show which one actually predicted them. The chosen method comes with receipts.
- Backtest R², MAPE and bias — on periods the model never saw — the direct answer to "how do you know?"
- Side-by-side method comparison — Holt-Winters, linear & log trend, growth rate, moving average and more, ranked by out-of-sample fit.
- Seasonality handled explicitly — seasonal decomposition with its own training window, so a short lookback doesn't lose the annual pattern.
- Refresh in the meeting — paste the new actuals, re-forecast, and export — no formula surgery.
 Forecast Lab · Air Passengers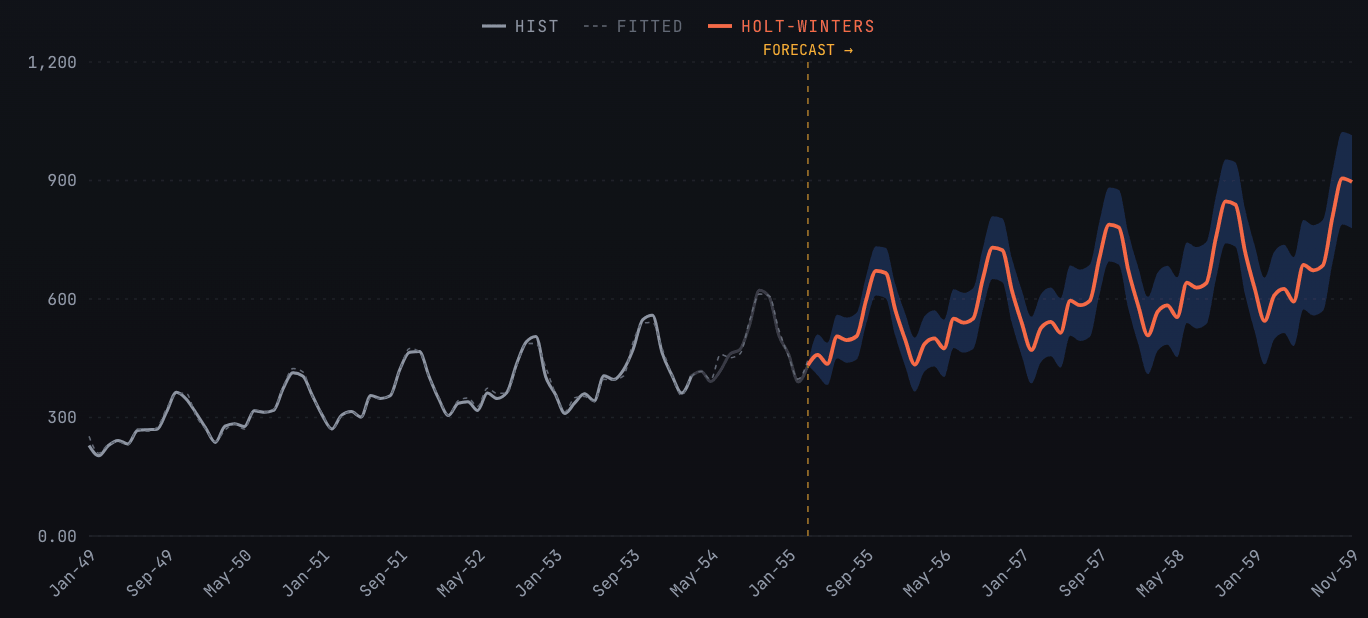
Show the range, not a single fragile number
When a client asks what happens if the assumptions are wrong, answer with a distribution. Stack drivers and assumptions, run thousands of simulations, and present P10 / P50 / P90.
- Up to 10,000 simulations — per run across the horizon you choose — results in real time.
- Distribution-driven assumptions — normal, lognormal and more, so churn, conversion or price ranges flow through to the bottom line.
- Combine forecasts with formulas — roll several client drivers into one probabilistic output.
- P10 / P50 / P90 percentiles — the downside case a board actually wants to see.
Monte Carlo Lab · 5,000 sims · h=36One workspace per client, one link to share
Keep every engagement in its own workspace with its forecasts and Monte Carlo models together. Share a read-only snapshot link — the client sees the chart, the method, and the accuracy, without needing an account or a file attachment.
From client actuals to a defensible deliverable
Three steps. No setup, no scripting. Just forecasts.
Load client actuals
Paste a series or upload the CSV export from their accounting or ops system.
Forecast and backtest
Compare methods, check out-of-sample accuracy, and layer on Monte Carlo where the assumptions are uncertain.
Share the snapshot
Send a link or export to drop straight into the deck — with the evidence attached.
The questions your clients will ask
“How do you know this forecast is any good?”
Backtest results are on the same screen as the forecast — accuracy on periods the model never saw, for every method you compared.
“Why not just do this in Excel?”
Excel gives you the number. It doesn't compare methods, hold out data, or show a client the range around the answer.
“Can we see this before the board meeting?”
Share a link. No account, no attachment, no version of the file that's already out of date.
Hand clients a forecast
that survives the questions.
Backtested methods, uncertainty ranges, and a shareable workspace per client — built in the time you'd spend wiring up another tab.
20 minutes · Your data questions answered live