Know what next month
actually looks like.
Paste your sales, bookings or order history and get a forecast with a realistic low and high case — so you can decide how much to order and how many people to schedule.
Paste a column · Get a range · Plan the low case
From spreadsheet to forecast in under 30 seconds
Paste a column of history, pick a method, read the range. No setup, no scripting.
You're making real decisions on a gut-feel number
Inventory buys and staffing schedules get locked in weeks ahead. Most of the time the input is last month plus a bit — and then you eat the overstock or the missed demand.
Ordering blind
Buy too much and cash is sitting in a warehouse. Buy too little and you're out of stock in your best week.
Seasonality gets guessed
You know December is different. Turning "different" into a number is the part that never happens.
Nobody has time to be the analyst
The forecast that would help requires skills and hours you don't have spare during a planning cycle.
Paste a column. Get a forecast that fits your history.
Copy the sales or bookings column straight out of your spreadsheet or platform export. Forecastion tests the methods for you and tells you which one fits your data best — you don't need to know why.
- Paste or upload, nothing to set up — a column of numbers is enough to get started.
- The tool picks the method — every method is scored on accuracy against your recent history, with the best fit flagged.
- Seasonality built in — busy months and slow months are learned from your history instead of guessed at.
- Change the horizon instantly — forecast the next 4 weeks or the next 12 months with a slider.
 Forecast Lab · Air Passengers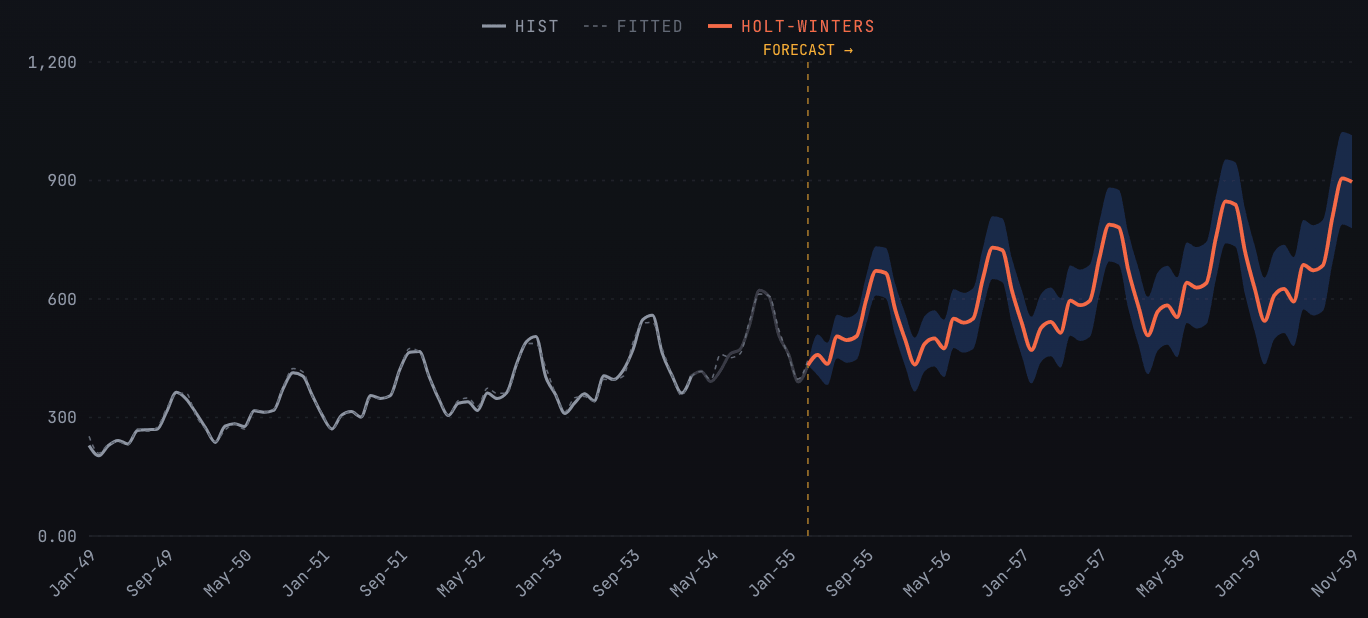
Plan with the range, not in spite of it
A single number tells you nothing about what to do when demand comes in soft. Simulate thousands of possible months and see how bad the bad case really is before you commit the order.
- A realistic low case — the P10 outcome — what you should be able to survive.
- Up to 10,000 simulations — per run, so the range reflects real variation, not one scenario tab.
- Model the levers you control — price, conversion, capacity, lead time — each with a range instead of a fixed guess.
- P10 / P50 / P90 outcomes — order for the middle, staff for the low, prepare for the high.
Monte Carlo Lab · 5,000 sims · h=36Keep every location and product line in one place
Save a forecast per SKU, per store, per service line — grouped into workspaces so next month's planning starts from what you already built, and the rest of the team can see it.
From last year's numbers to next month's plan
Three steps. No setup, no scripting. Just forecasts.
Paste your history
Sales, orders, bookings, appointments — a column of numbers from any export.
Get the forecast and the range
See the expected path plus the low and high cases you should plan around.
Order and schedule with it
Export the numbers or share the link with whoever signs the PO.
What operators ask before they start
“I'm not an analyst — can I use this?”
Yes. Paste a column of numbers. The tool reports which method fits your history best; you don't need to know how it works.
“Does it handle my busy season?”
Seasonality is learned from your own history and built into the forecast, so peak months aren't averaged away.
“How much should I order for a bad month?”
Run a simulation and plan against the P10 low case instead of a single point estimate.
Stop operating
on a gut-feel number.
Paste your history, get a forecast with a realistic range, and make the call with something better than last month plus a bit.
20 minutes · Your data questions answered live